What is a business reporting tool / software?
All businesses crave visibility of what’s going on. Where sales are coming from, why some customers are leaving, where processes can be made leaner, where cost savings can be made, and where new opportunities are emerging.
A good business reporting tool or piece of SaaS software will help you see this. Many people call these data analytics tools or business intelligence tools, but no matter what you call them, they serve the purpose of letting you see what's going on across your business.
All reporting software will help you report on your business but the best ones will show you your data in visual charts and graphs so the information is clear and easy to digest.
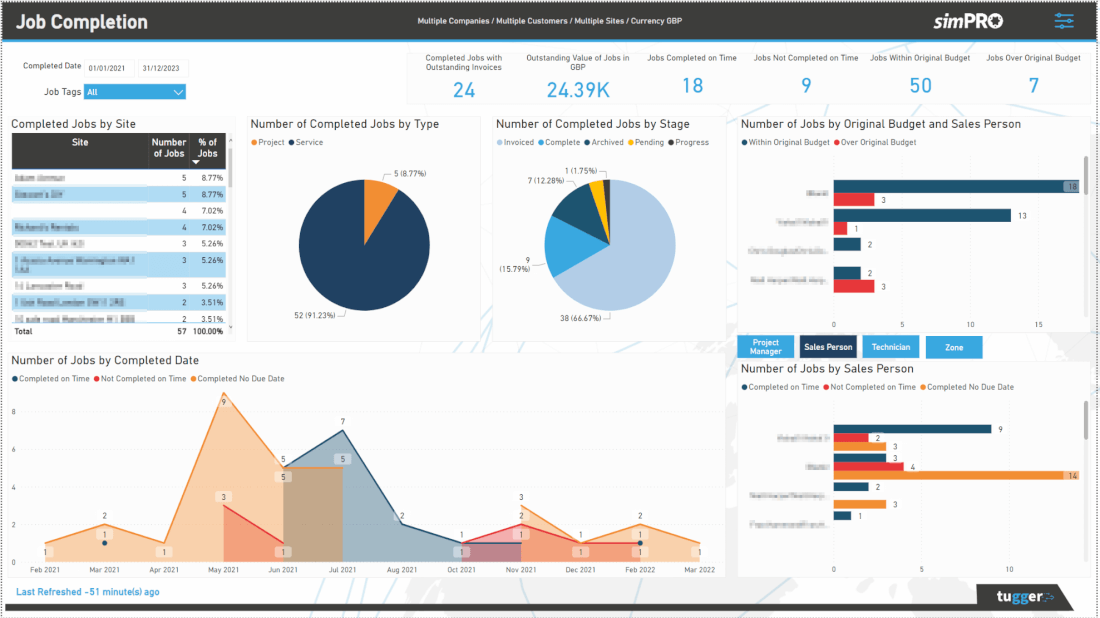
The screenshot below is an example of a reporting dashboard in the popular re-porting tool Microsoft Power BI.
Benefits of business, or data reporting tool
It’s not a wildly exaggerated statement to say that getting honest, data-driven insights on what’s going on in your business can have transformative effects. You learn so much about your company - where time can be saved, efficiencies made and costs reduced. And also about your customers - what they love, why they leave, and where you can make improvements for them.
Having a tool or a piece of software to help you see this is a game-changer. If you’re relying on spreadsheets, or people to manually dig around for this info, then you won’t look at it often enough and you’ll miss issues and opportunities by being slow to react. You also run the danger of inaccuracies. Often when people have to dig around for information manually, what they find isn’t accurate, and they use a different approach each time meaning there's no honesty in any comparison.
But when it’s been loaded into a system it’s all there. You just need to make sure it’s set up correctly once, and you really do need to make sure it's set up correctly, then you're away!
Choosing the best data reporting software for you
Before you choose a data reporting or data analytics software, think about what you want to achieve in the short and long term including what KPI’s you need to track.
You may already have some reporting in your business systems, by this we mean the system or systems you input your data into day-to-day. This built-in reporting could be enough for your needs.
For example, the Harvest time tracking tool already has built-in reporting so you could see something like how long a designer has spent on a job. HubSpot also has built-in reporting, which can be semi-advanced but only on the more premium packages. But on the other versions, you would be able to see things like where a sales lead is up to.
But other tools that sit outside your system's in-built reporting, such as Power BI and Tableau give you more flexibility because you can build your own custom reports. You can also input data from multiple sources. So, say you’re using HubSpot for your marketing and sales activity, and Harvest to track your team’s time, then you could combine data from both these systems into one report. So you could look at how much time your sales team spent on a specific activity and whether or not it generates sales. This alone would be good to know, but with this data, you can also now get a true cost per sale as you’re factoring in people-based costs.
This is just one example but you get our drift, your options are much greater when you’re building your own reports. And if you are looking longer-term that’s a great option to have because your reporting can scale with you. And the two tools we've mentioned in this piece aren't expensive. In fact, there are free versions so it’s worth investing the time now.
Another thing you’ll want to look at is how the product looks. The visual dashboards and displays need to make sense to you if you’re going to be looking at them frequently, and you need to like the look of them. So it’s not a case of style over substance, it’s a case of having both!
Also, some of the views in reporting tools are static, so you see one report. Others are interactive, so if you see something that requires your attention, you can click on aspects of the report to dig deeper or show a different view or filter. This can become a pretty big deal as it avoids you using these reports to identify issues or opportunities, then manually having to dig around elsewhere for further answers, which you may not be able to find.
Summary
This is a very quick summary of data reporting (also sometimes called business intelligence or data analytics.) The chances are you're already looking at some data within your business, so you are doing some data reporting. Maybe you have Excel spreadsheets, or you manually pull data together from different places each month for a presentation. We hope this article has shown you that there are data reporting tools and software’s available that will help you understand your data better with more efficiently, accuracy, and insights - they’ll also make it a heap easier and quicker.