Simplifying Data Transfers
Tugger® makes your life easier by removing the headache of getting your data together, ready for reporting in your Business Intelligence tool.
Maybe you’ve found Tugger because you’ve had a go at this yourself? If so, you’ve probably discovered that the reporting is super-simple. Getting your data into these systems however, is not.
Getting the data out of your data sources, (the systems that generate the data e.g. GitHub, Harvest and JIRA) is where the pain kicks in. And to be honest, where the pain ends - once you’ve solved this, you’re flying.
Tugger removes this problem, making the process of seeing your data in beautiful reports a piece of cake.

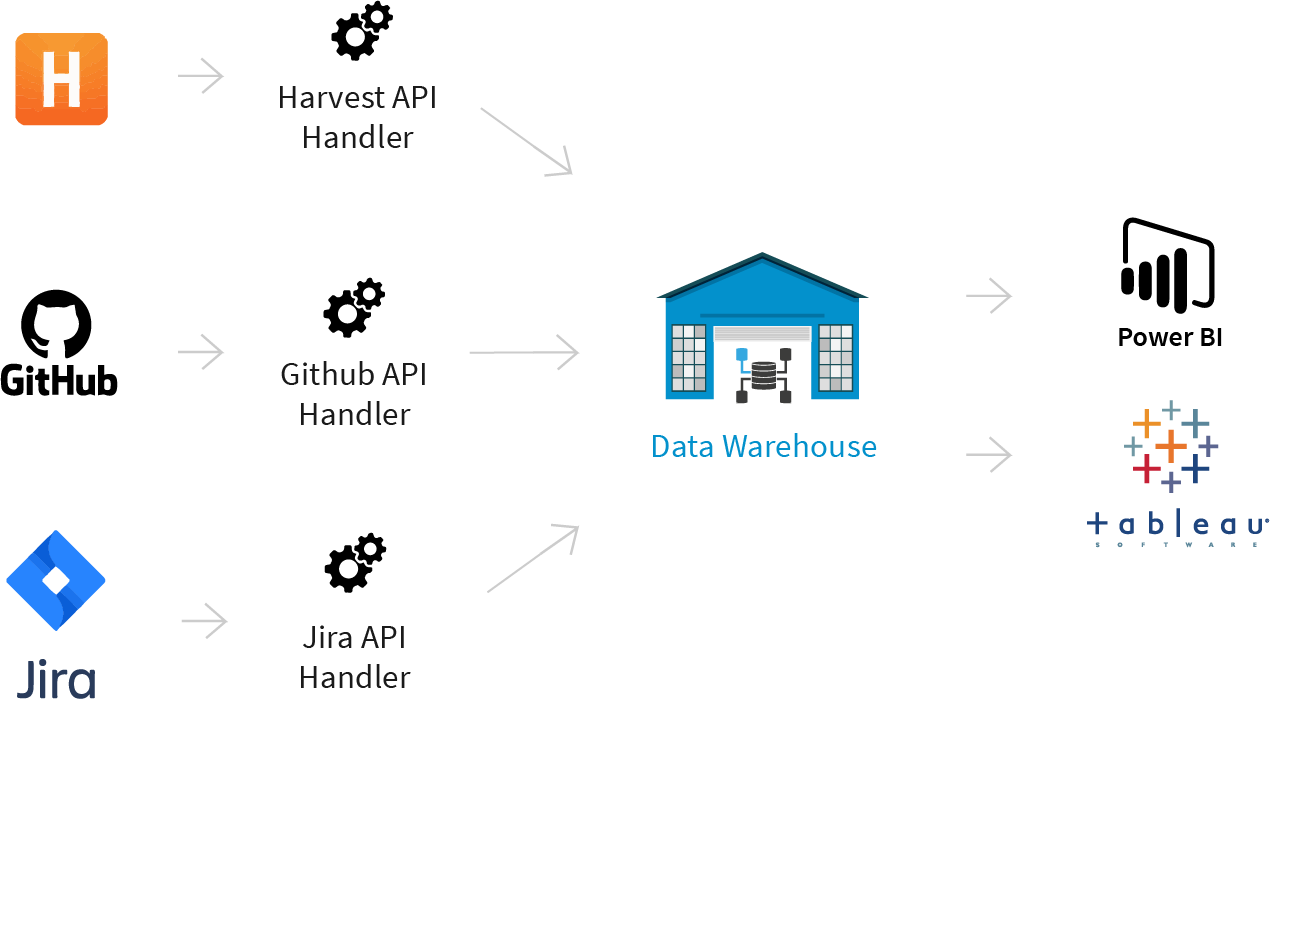
Data Transfer without Tugger, what’s the big deal?
If you want to get your data into Microsoft Power BI and let’s say your data source is GitHub, first you’d need to use GitHub’s API - that got technical quickly. This API, or Application Programming Interface, is what defines the interaction between systems, so in this case Microsoft Power BI and GitHub. As you start working with the API, you’ll soon realise that the documentation for the API is humongous. And now you need a programmer. If you aren’t a programmer yourself, who probably has a million other things to be cracking on with.
Next issue, the API has ‘rate limits’, meaning the amount of data you can transfer directly via the API is limited. So, you need somewhere to store your data and make sure you don’t hit these limits. By the way, if you do hit the limits, not all your data will be transferred, resulting in some very odd reporting. So now you need a data warehouse. Unexpected costs are creeping in, and that report you said you’d have ready by the end of the week is looking increasingly unlikely.
Once you have your data in the data warehouse, you’re still not done. You need to create a data model so you can transfer this data into Microsoft Power BI and have it in a useable form. Without this, your data will be all mixed up, one huge headache to unravel. There’s also risks that one small slip up will create pretty skewed reports.
Exactly how does Tugger make this easier?
Tugger connects to your data source over a secure connection and ‘Tugs’ your data from your source into Tugger’s data warehouse. Yup, no programming needed, you can just forget we ever said API. From a user perspective, you just sign in to Tugger and your data source and the rest is done. See our step-by-step guide.
Included in your Tugger cost, is storage of your data in Tugger’s enterprise-level data warehouse. Find more about data security.
So now your data is in Tugger’s warehouse, you need to get it into your Business Intelligence reporting tool. That’s simple too, we provide a secure ODATA url. Don’t be put off by the word ODATA, this simply means you have a url to copy into your Business Intelligence tool, that’s it. This url is unique to each of your ‘Tugs’ and has it’s own username and password for security.
You don’t even have to worry about building a data model, we’ve done that for you. So when your Business Intelligence tool pulls in the data, it uses this structured model. Your data will be organised, a bit like an Excel spreadsheet.
Of course you can always alter the data model yourself, should you wish to show different fields etc. And you may want to ‘Tug’ from multiple data sources and pull them into the same report. Giving you a complete picture across multiple systems.
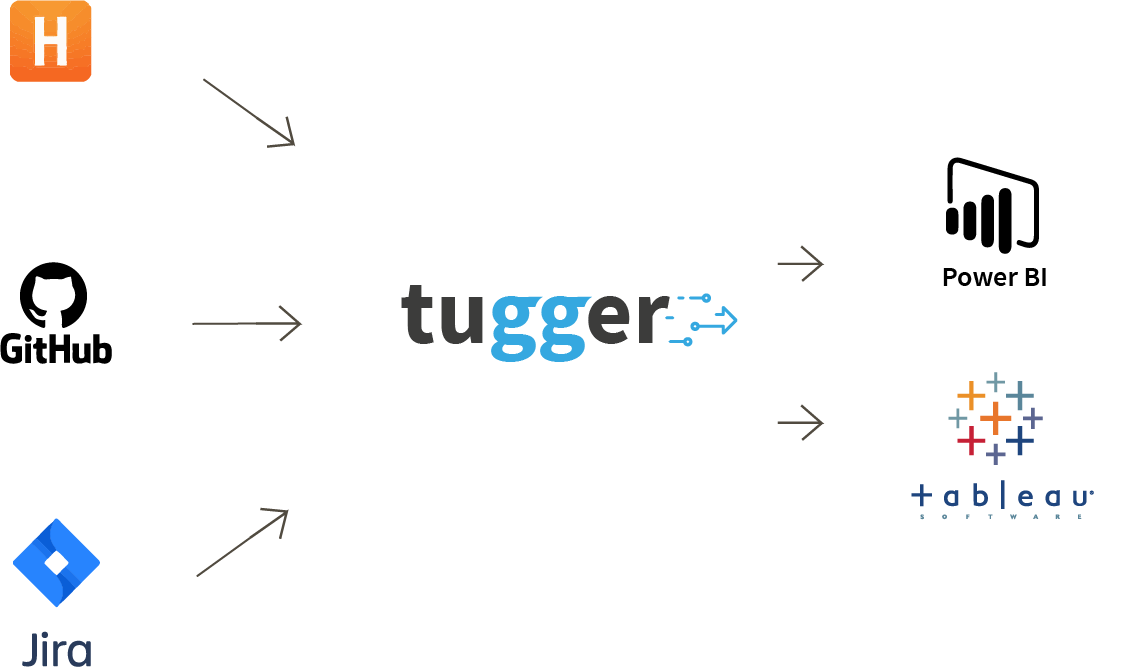

The Tugger Bonus
To make your life that little bit easier still, lots of our Tugs come with template reports that are completely free. So you can literally be up and running, and reporting, in minutes instead of weeks or even months in some cases.
If this sounds too good to be true, put us to the test. Sign up for a FREE 30 day trial, with no obligation to continue and see how simple Tugger is for yourself. Honestly, reading this page is more complicated than Tugger - you’ve done the hard part.
Before Tugger, our reporting was fragmented. Our data lacked clarity. Tugger changed all of that, giving us unified, visually engaging reports across all areas of our business, making data insights much easier to understand and act on.
We used to struggle with the time it took to manually refresh many clients' reports each month, where small errors could derail the process. Tugger has completely streamlined this, automating updates and allowing our staff to access reports daily. It’s been a game-changer for our team and our clients.
I want to commend Tugger's team for being a credit to the company. Every person I've interacted with has been knowledgeable, friendly, and incredibly helpful. I've felt well supported and looked after throughout the entire process. Well done!
I've never encountered something as user-friendly as Tugger – a simple flip of the switch, and it's up and running. I was genuinely impressed. With standard reporting templates right from the start, I gained instant visibility into our individual companies and entities. To be honest, it was quite remarkable.
Tugger has revealed data that has given us brand new ideas around the ways in which we can deliver our service to our customers. If you want somebody to work with to grow your business, you definitely need to work with Tugger
It’s a simple set-up for getting your data and being able to report straight away. Even if you’ve got no Power BI knowledge.
With Tugger, reporting has become straightforward and remarkably clear, making it easy for us to get what we need.
