What is Microsoft Power BI?
With over five million users globally, you've probably heard of Power BI. And given it is part of Microsoft's Office 365 version E5 suite of tools, you may even have it downloaded on your computer already. But what exactly is it?
The short answer is that Power BI is a data analytics tool. Or in Microsoft’s own words, it’s ‘an interactive data visualisation software product.’ Sounds fancy but arguably, Power BI’s charm is that as far as data analytics tools go, it’s actually pretty simple. It’s a no-code tool, which means that in theory, you don’t need a developer to help you get set up. Although you may choose to use one, depending on the complexity of what you want to see.
The killer hook is that it allows you to visualise data in real-time via dashboards, charts, and graphs. You no longer have to pull off weighty reports manually that only give you a siloed view which will quickly date. You see the evolving picture in live dashboard views to get insights and answers immediately. Unsurprisingly, many businesses are using Power BI to get insights on their sales, projects/jobs, and customers, so they can make better decisions and steer their business.
What Does Power BI Stand For?
Power BI stands for Power Business Intelligence. The "BI" in Power BI refers to Business Intelligence, which is the practice of using data to make better business decisions. Microsoft's Power BI tool puts that capability into a simple, visual platform that anyone can use. Whether you've seen it written as Power BI or PowerBI, it's the same tool, and it's one of the most widely used business intelligence platforms in the world with over five million users globally.
What does reporting in Power BI look like?
Here are some examples of what Power BI reporting looks like.
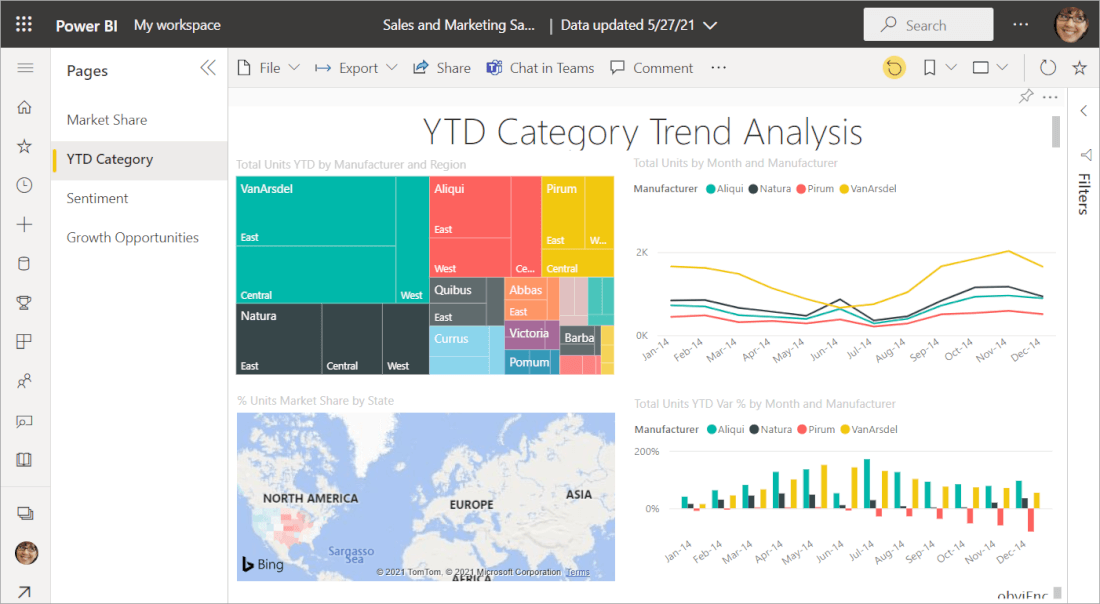
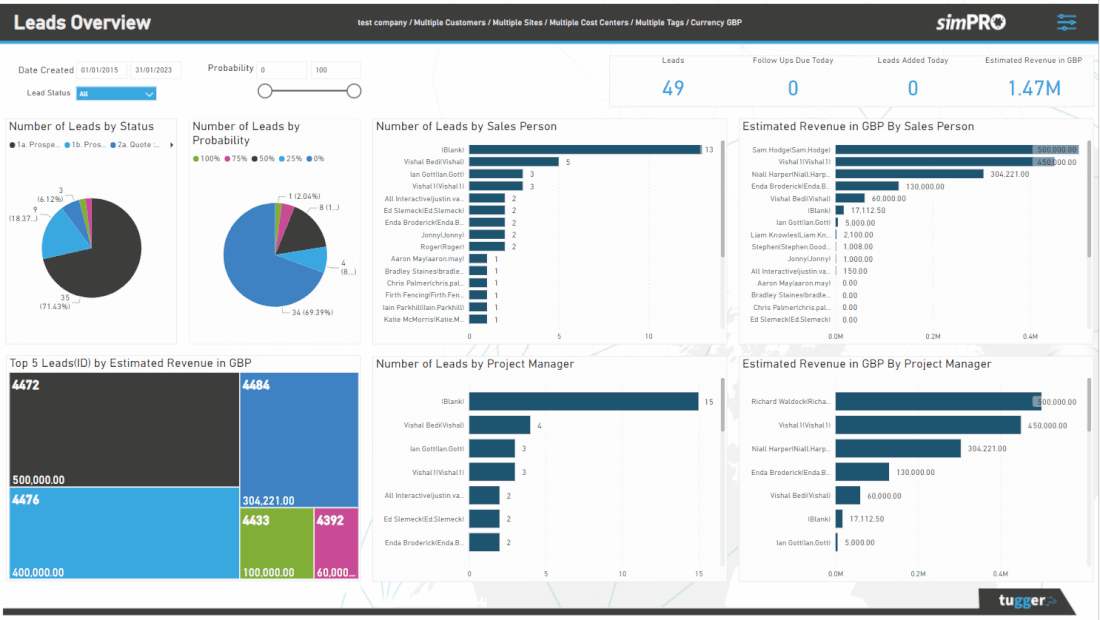
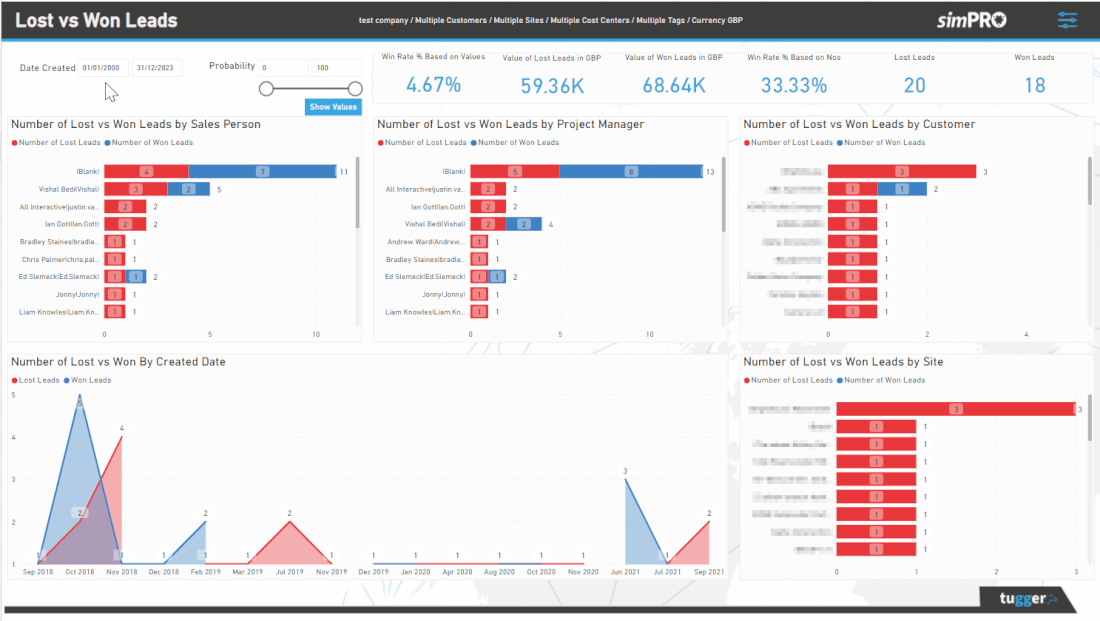
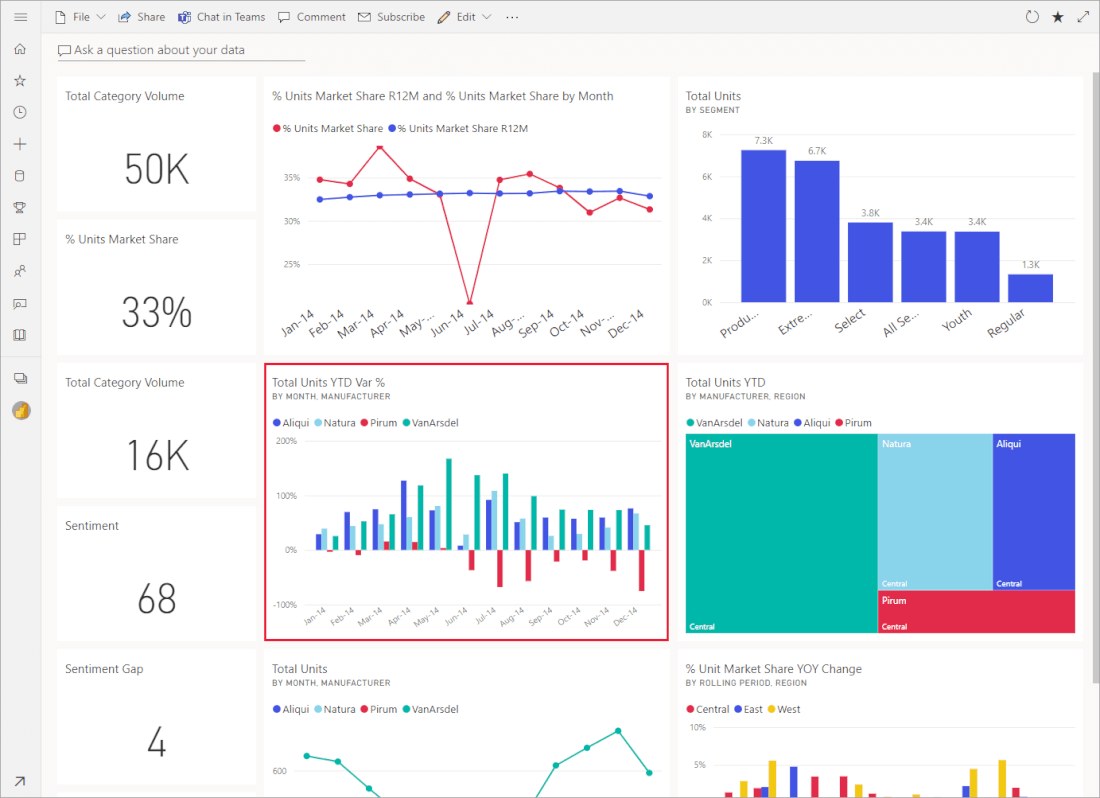
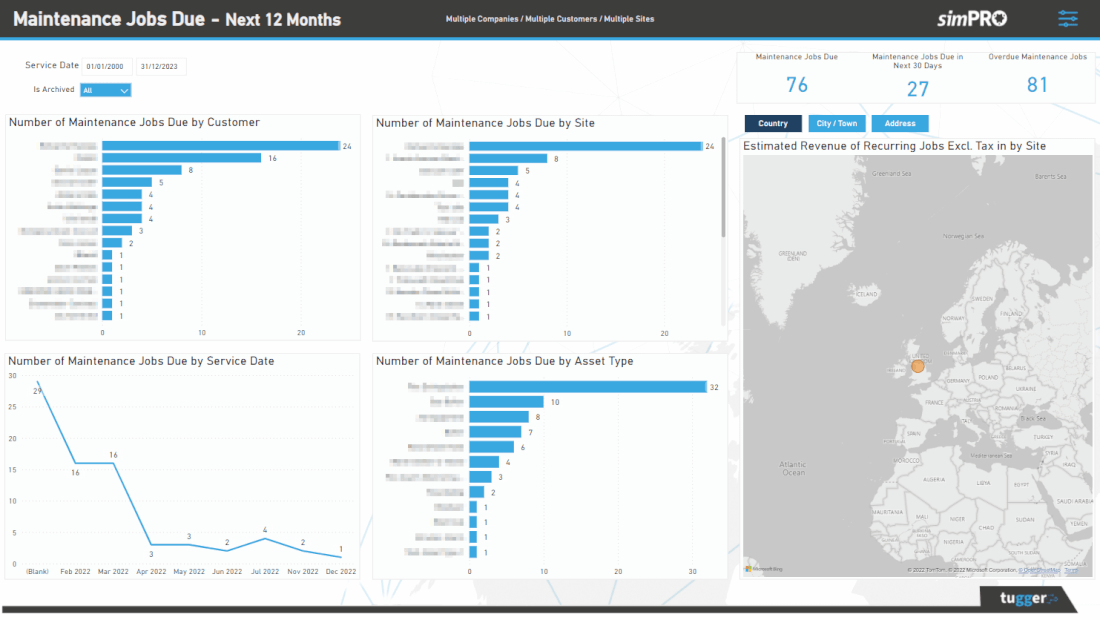
As you can see this visual picture makes the data easier to digest. But it doesn’t just make your data more pleasing to the eye. Power BI brings your streams of data together so you get a fuller picture of what’s going on. In a tool like Excel, you look at one set of data, whereas here you can join data stories together to get a bigger, more honest picture where you see how each area impacts another.
Dashboards aren't the only way to get answers either. If your accounts live in Xero, a Xero MCP server lets you ask questions of that data directly through AI tools like Claude, ChatGPT and Gemini.
Here’s an example scenario:
Your company manages a large volume of tradespeople offering jobs from plumbing to painting. You’ve just introduced floor sanding as a service. You look at sales data in Excel and see that this new venture is bringing in a ton of new work so you pump a heap of money into marketing this new service, bringing in more and more of this type of project.
The same company looks at sales data in the platform and compares it against timesheet submissions and costs to the business. You spot that actually, the floor sanding takes too long to deliver and costs to the business are too high so you don't make a profit on these jobs. So you stop this new venture and focus on painting, where you have the least outlay and the most return per hour.
This is one very simple example, but you can see how the real and complete data you see in Power BI will lead you in a completely different direction.
How do I get my data into Power BI?
This isn’t always the easiest but there are ETL tools (stands for extract, transform, load) that can take this off your hands. They will take the data out of your source, so your CRM or time-tracking app for example, and pop it into Power BI via a data warehouse. With this approach, you won’t need development support. And if you're weighing up how AI tools fit into this picture, our guide to MCP vs API explains the difference and when each one makes sense.
In our blog How Do I get my data into Power BI, we cover this option in more detail, as well as offering some alternatives.
More recently, there is another option that skips the dashboard altogether. You can connect your systems to AI tools like Claude and ChatGPT and simply ask questions in natural language, getting answers straight from your live data. This works through an MCP server, and our guide explains what an MCP server is and how it fits in.
How do I get Power BI?
There are tiered versions starting with a free version that's available for anyone to sign-up and download. Then there's Pro, Premium and Enterprise. There are also two types of Power BI, these work well together.
- Microsoft Power BI Desktop
- Microsoft Power BI Service
Depending on your package - Free, Pro or Premium, you may have Desktop and Service included, and it’s worth noting that the Pro tier is available free with Office 365 version E5 subscriptions
Still with us? Yes, there are lots of options, but ultimately that’s a good thing right? You can choose what you need for your requirements and Power BI has the potential to suit small to enterprise-level businesses.
Power BI Desktop Is something you will download to your local machine, it’s free. Here you will add your data, from one or more sources, and set up your reporting - so your dashboards and charts. It’s important to understand that ‘reports’ in a Power BI context don’t mean long, drawn-out spreadsheets that you need to wade through periodically. It’s live dashboard views that give you insights at a glance.
In the Desktop version, reports can be shared directly with colleagues or uploaded to the Service.
Power BI Service is cloud-based (or SaaS). So you can access it from anywhere, including your mobile. In Power BI Service, you share your reports with the wider team and invite people to collaborate.
If you’re keen to understand more detail around the key differences between the offerings, Microsoft has put this great article together Comparing Power BI Desktop and Power BI service.
What else should I know about Power BI?
As we've mentioned, Power BI has a free version, it's no-code and you can use an ETL tool to get your data transferred over, so by now you're probably thinking it's a bit of a no-brainer. And it is. But like most things, you get more out of it the more you put in. So whilst it can be used in very basic terms, you may want to grow your offering, take advantage of new features, tips and tricks. Keep an eye on our webinar page where we run frequent Power BI-based sessions.
Power BI is brilliant for visual reporting, but sometimes you just want to ask a question and get an answer. That's what Tugger's AI Insights is for. See how it works when you connect QuickBooks to Claude, or explore any of our 50+ connectors. Try Tugger free for 10 days or book a demo.